Tips for Debugging Angular2 TypeScript in VSCode
TypeScript debugging for Angular2 can be setup easily with few steps. We just need to configure the transpiler and debugger properly before launching chrome with debugging on. Let’s go in steps.

TypeScript is the recommeneded approach for developing Angular2 Applications. Angular.io has a fairly complete documentation for TypeScript compared to that javascript.
3 basic steps to debugging TypeScript
- Set up the project.
- Set the launch and attach config to the TypeScript build folder.
- Install the Debugger for Chrome vscode extension.
- Start chrome with debugging enabled (different for OSX/Windows)
1. Set up the project
I have already set up a basic project in github and you are more than welcome to clone from there.
https://github.com/amilsil/angular2-ts-debugging.git
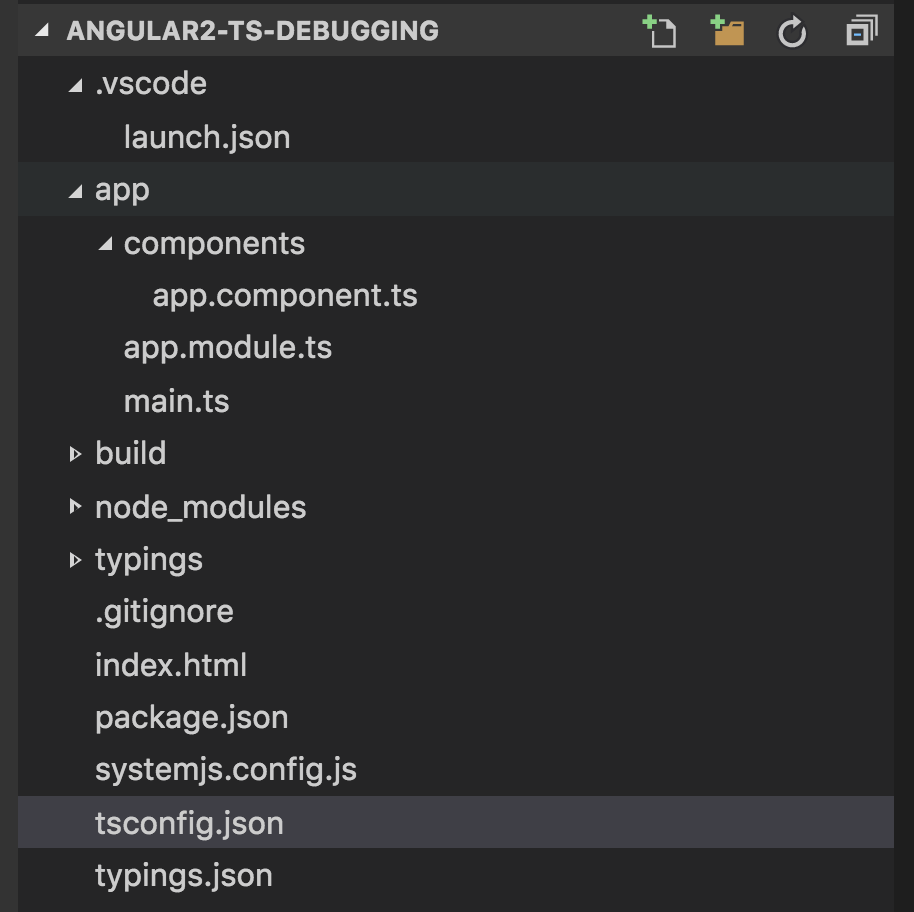
The project is the most simple angular2 project ever.

However tsconfig.json has the TypeScript transpiling configurations. I have configured the project to put the generated javascript in the build folder, as below.
{
  "compilerOptions": {
    "target": "es5",
    "module": "commonjs",
    "moduleResolution": "node",
    "sourceMap": true,
    "emitDecoratorMetadata": true,
    "experimentalDecorators": true,
    "removeComments": false,
    "noImplicitAny": false,
    "outDir": "build"
  }
}
2. Set the launch and attach config to the TypeScript build folder.
TypeScript itself is not intepreted by the browsers, thus needs to be Transpiled to javascript by the TypeScript compiler (tsc). To be able to debug TypeScript though, we need a mapping between the generated javascript and the original TypeScript code. These source maps are in the .js.map files. When we launch chrome for debugging, we need to let the VSCode debugger know where the javascript and the source map files.
Since we transpile the TypeScript to the ./build folder here, we configure the .vscode/launch.json files webRoot to ${workspaceRoot}/build as follows.
{
    "version": "0.2.0",
    "configurations": [
        {
            "name": "Launch Chrome against localhost, with sourcemaps",
            "type": "chrome",
            "request": "launch",
            "url": "http://localhost:3000",
            "sourceMaps": true,
            "webRoot": "${workspaceRoot}/build"
        },
        {
            "name": "Attach to Chrome, with sourcemaps",
            "type": "chrome",
            "request": "attach",
            "port": 9222,
            "sourceMaps": true,
            "webRoot": "${workspaceRoot}/build"
        }
    ]
}
3. Installing the Debugger for Chrome vscode extension
This is pretty straightfoward. In VSCode, go to Extensions tab in the left hand navigation, and search for Debugger for Chrome and install that. You’ll have to restart VSCode for the extension to kick off.
4. Starting chrome with debugging enabled
4.1 Let’s just install the dependencies and start our lite server first.
Go to your project folder, say angular2-ts-debugging in the terminal (Mac) or command window (Windows). To install dependencies and run the application, run the following commands.
npm install
npm start
At this time, the application will start running and a new chrome window (or your default browser) will open with your application url. This browser windows did not start with debugging on. Close all the instances of chrome.
4.2 Start chrome with debugging on
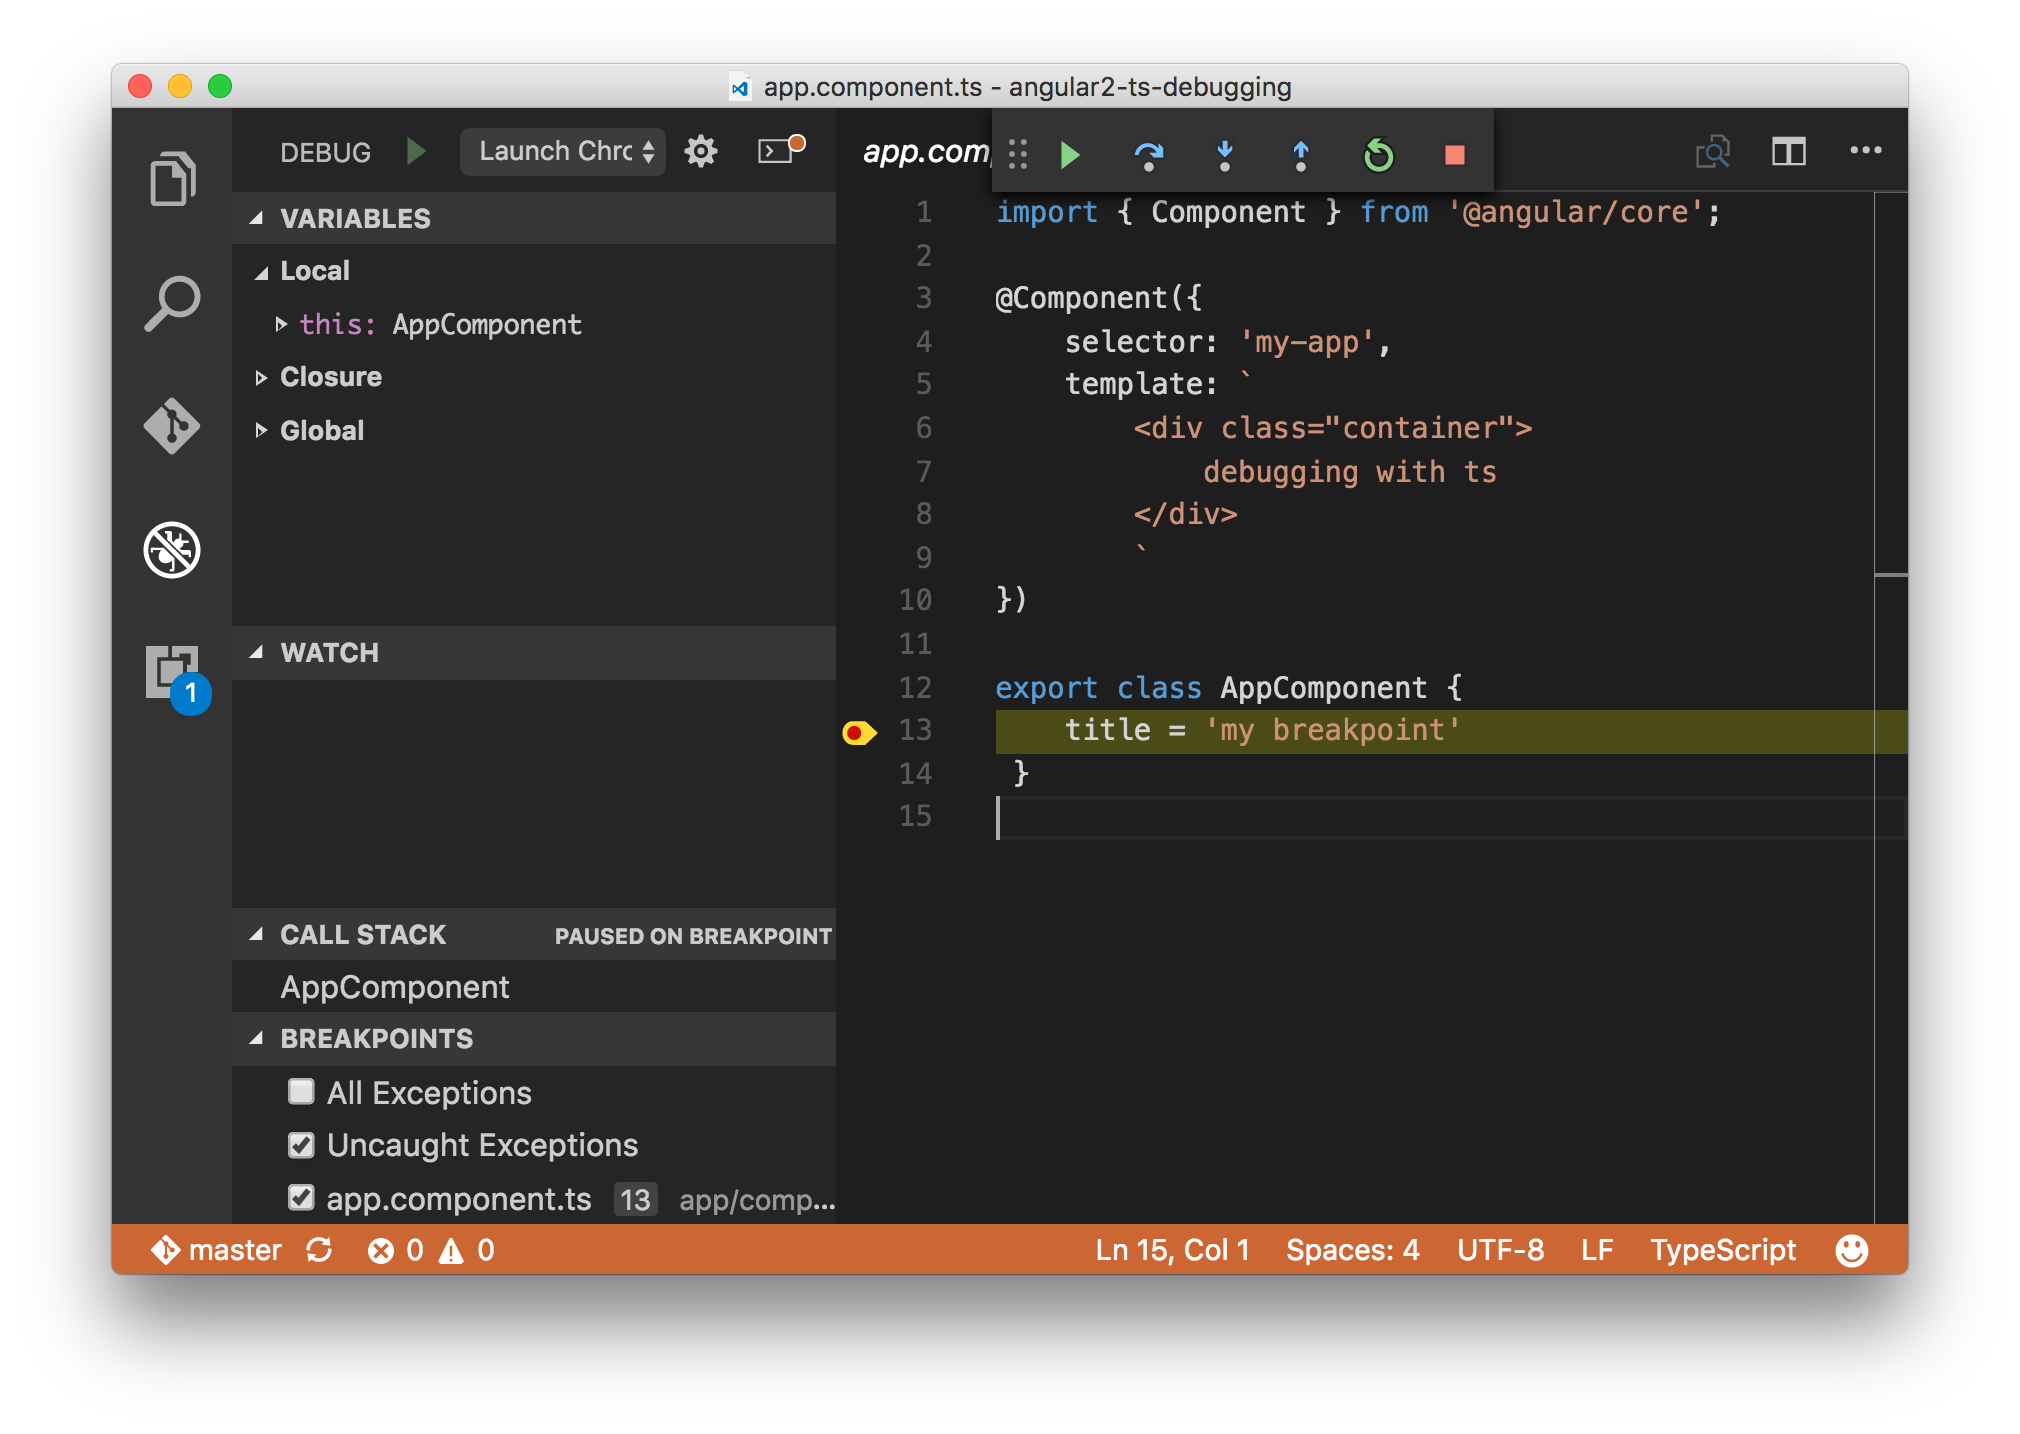
Go to Debug tab on VSCode and select launch from the dropdown list. Press the run button. This will start a new chrome with debugging on. In other words, it will start a debugging service on port 9222.
Add a breakpoint at the AppComponent.ts file as below and refresh the chrome window. It should hit the breakpoint.